The Gender Pay Gap
Introduction
In April 2017, Gender Pay Gap legislation came into effect under the Equality Act 2010. This requires any employer with 250 employees or more to publish their gender pay gap for their employees. The report shows the difference between the average pay of female and male employees.
We are committed to treating our people equally and fairly and welcome the opportunity to report on our gender pay gap data. Remuneration at Moss Bros Group is determined by the role and not the individual or the gender. A high proportion of the more senior roles are filled by male employees which is the main reason for the gender pay difference.
At Moss Bros Group we are committed to diversity and therefore we are constantly working on the gender balance of our employee population. The results below are based on a snapshot on 05th April 2020, which was also at the height of the pandemic and the first lockdown.
Our Findings
In 2020 The Office for National Statistics (ONS) reported that the gap among full-time employees fell to 7.4%, from 9.0% in 2019. Among all employees it fell to 15.5%, from 17.4% in 2019.
The mean gender pay gap is 43%. This result is driven by several factors including that we are a formal menswear brand, with the majority of employees in the retail estate and senior management being male.
We have not identified any inconsistency between female and male employees’ pay for the same role. The business also endeavours to recruit a diverse workforce including more female employees.
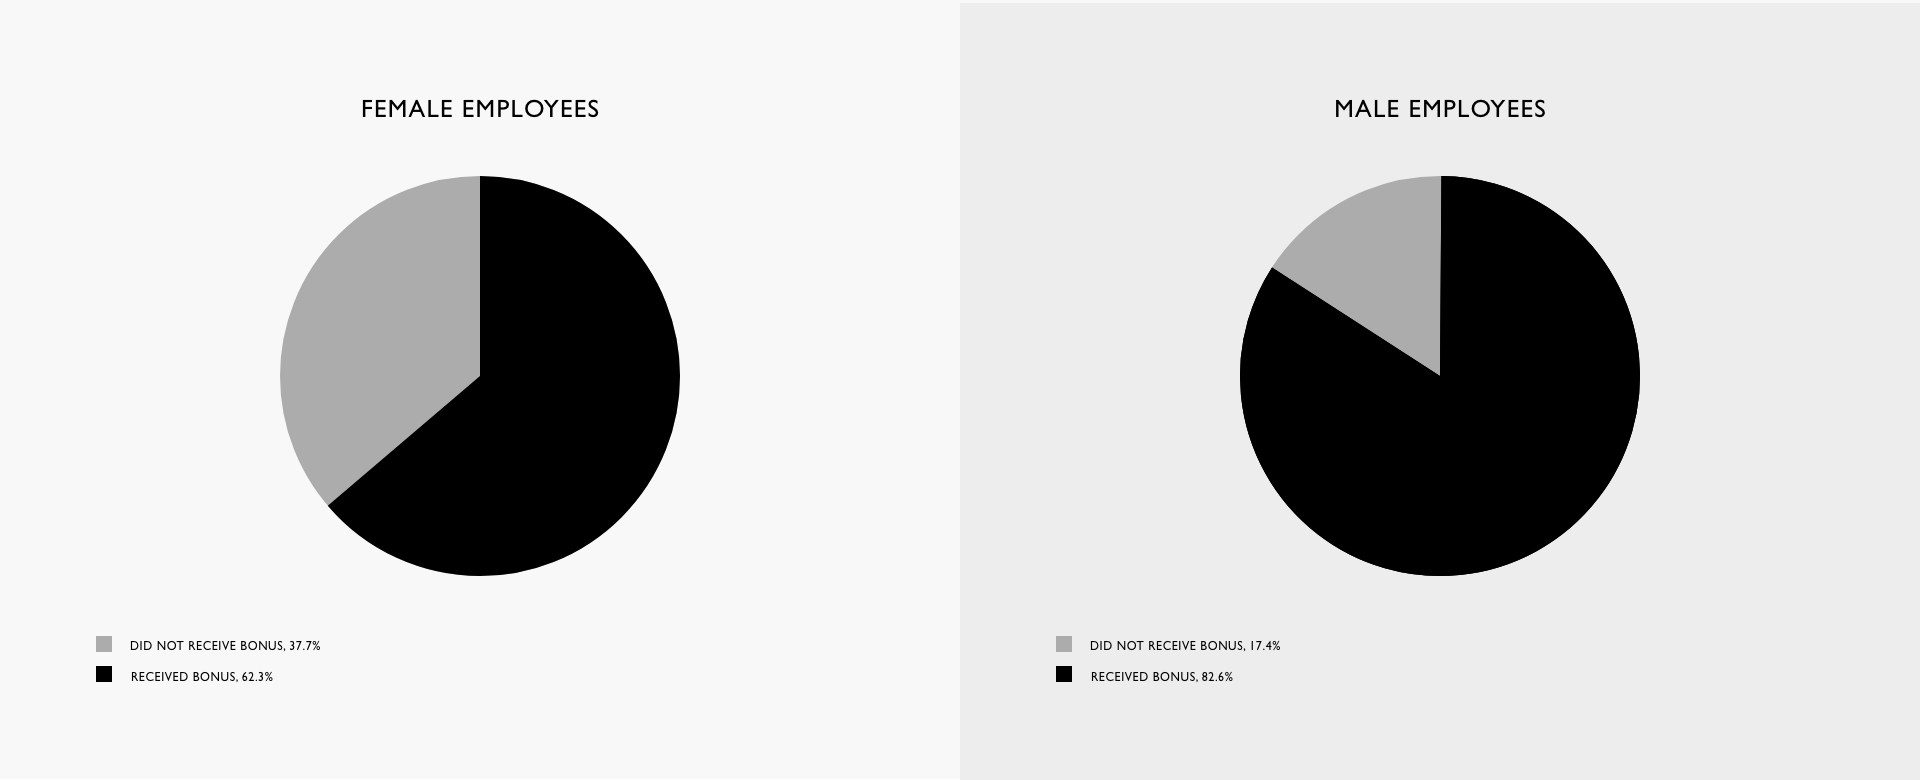
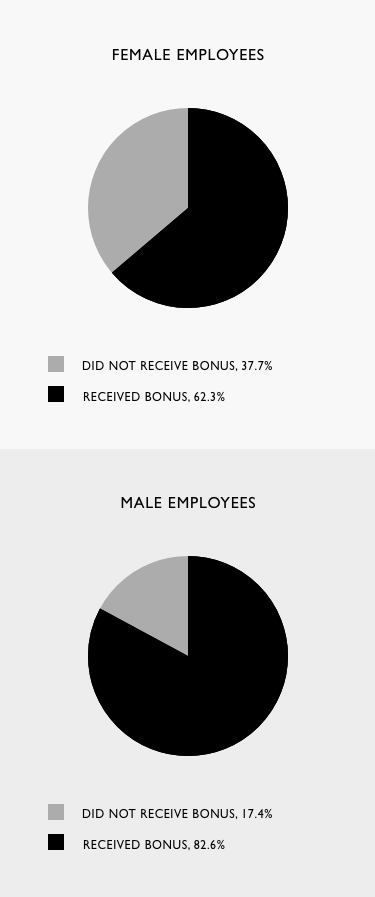
The average bonus report is based on the sales commissions paid to retail employees and it is heavily influenced by the proportion of fulltime contracts. It shows that there is a slight increase compared to 2019 in favour of male employees, who make up a higher proportion of fulltime workers.
Gender Demographic
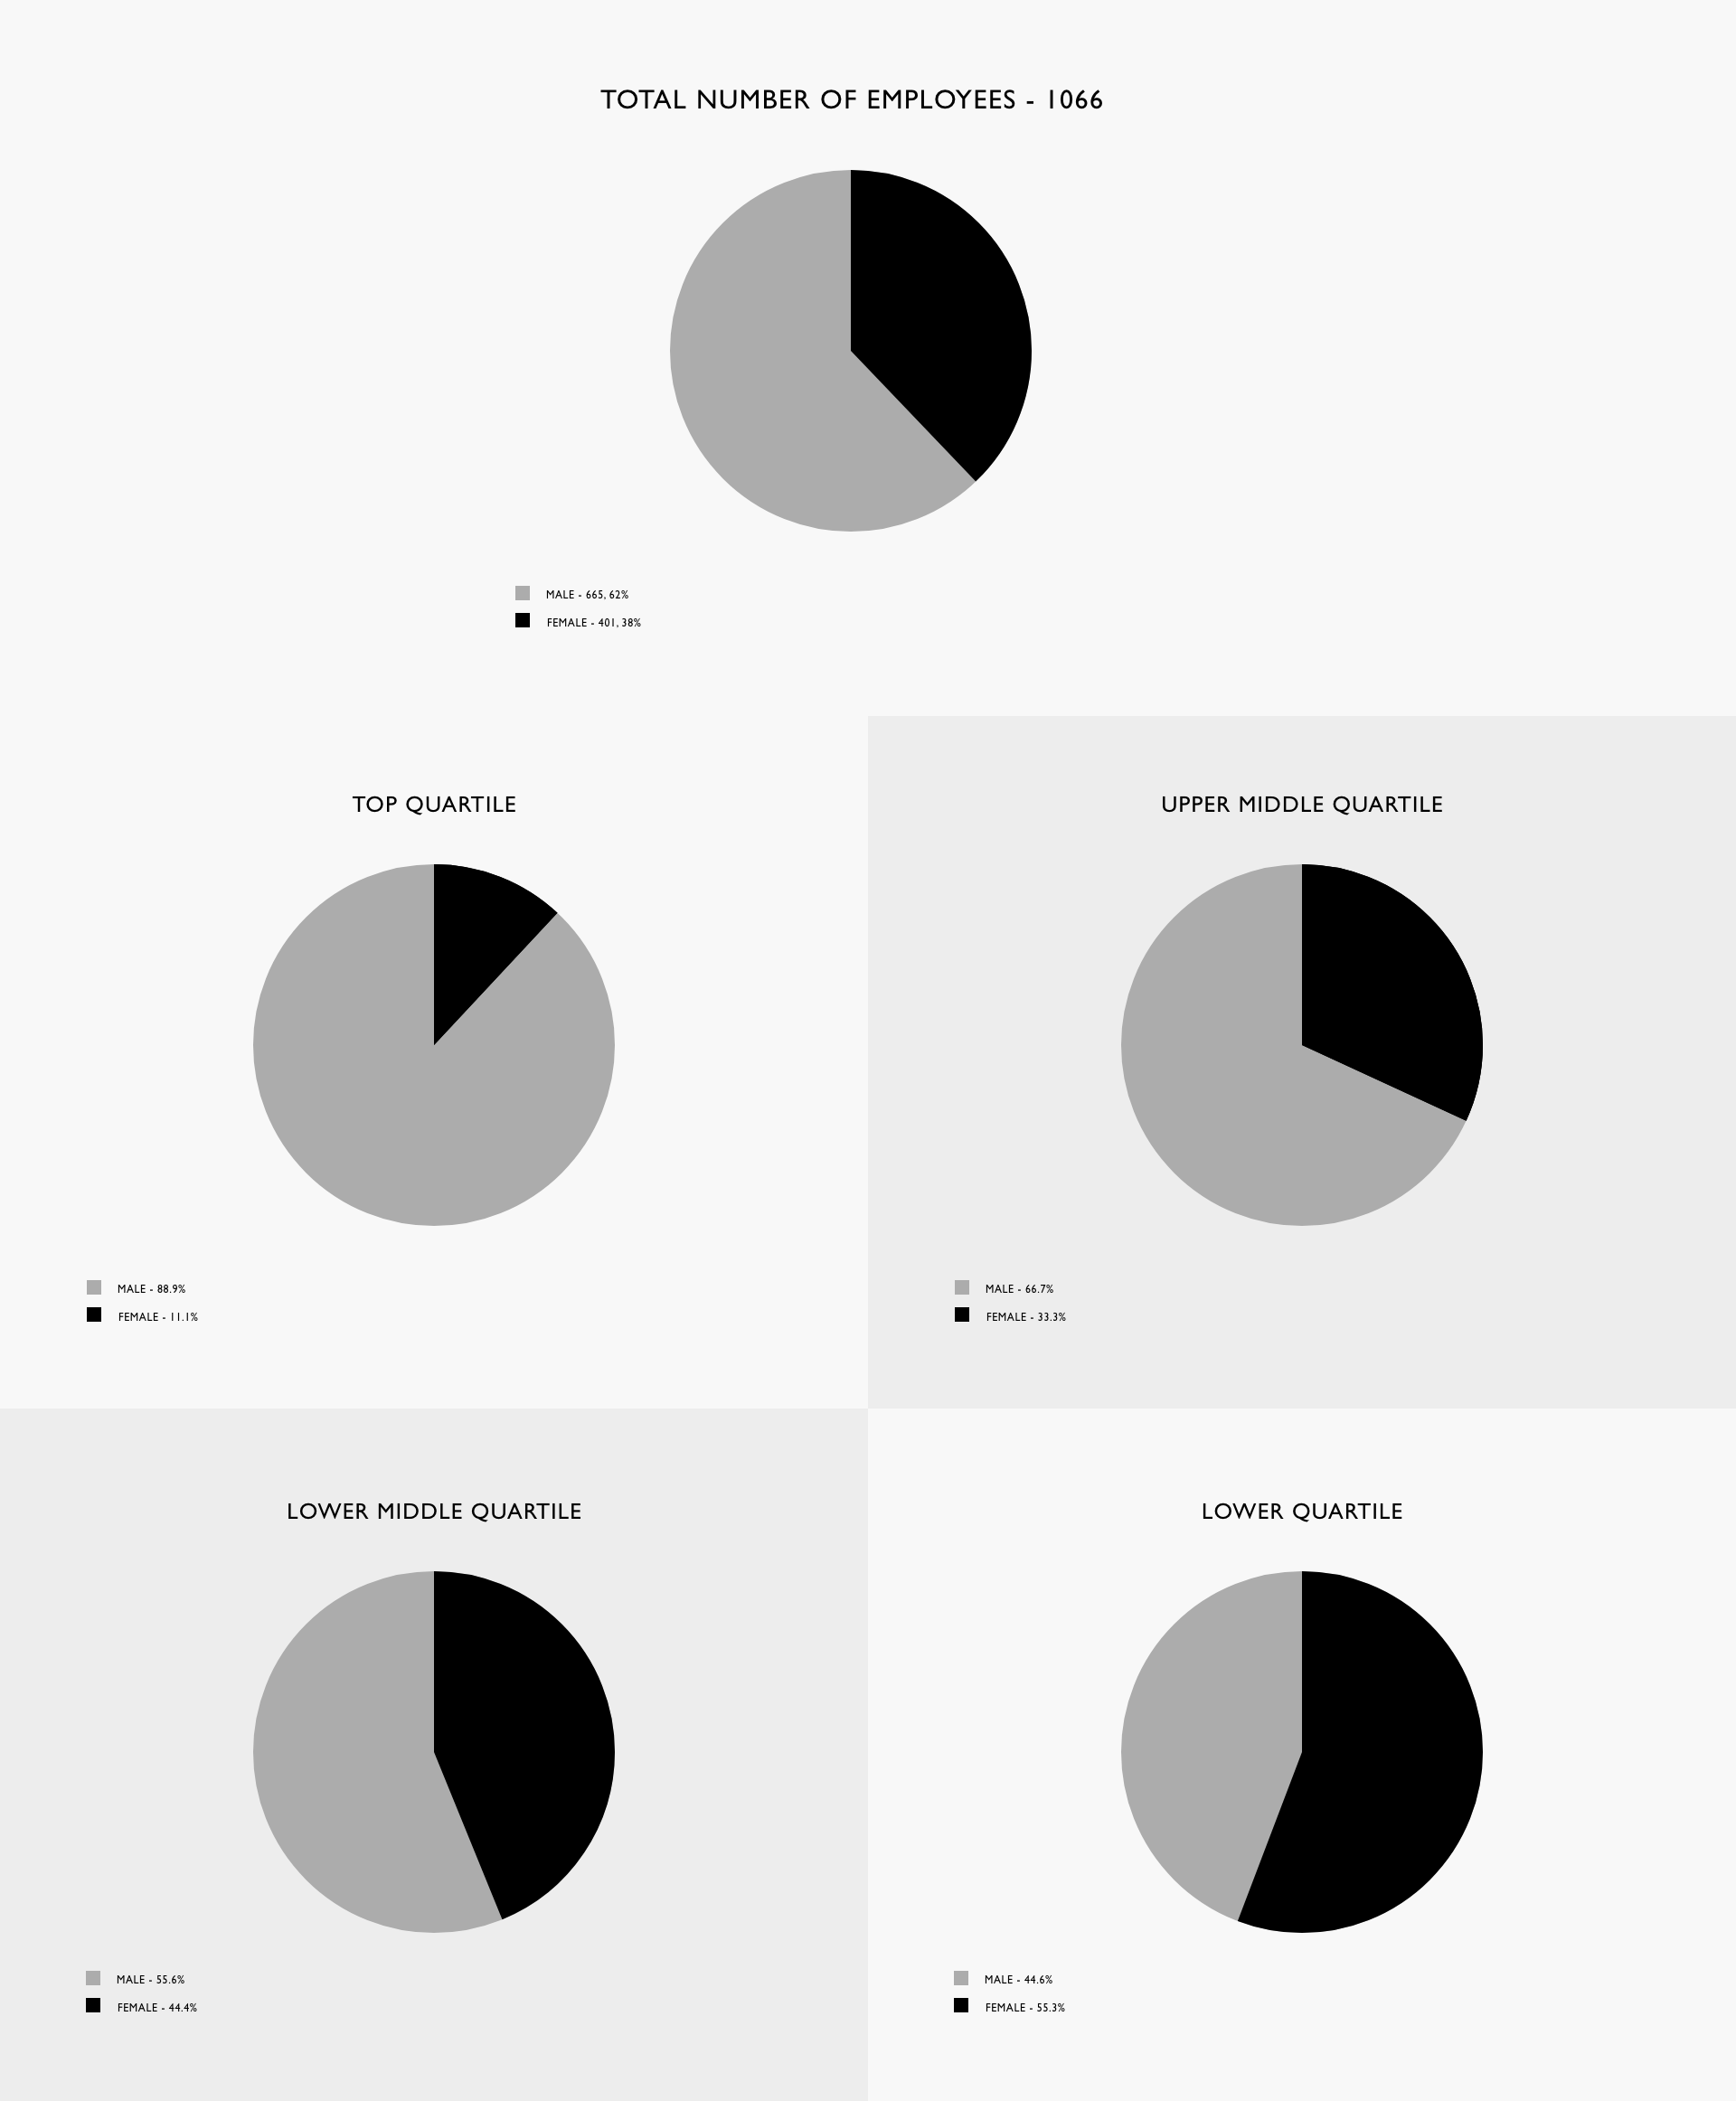
The data below shows we employ a high proportion of men at all levels across the company. This difference is slightly higher in our more senior Head Office roles, which sit in the upper to top quartile of our total population.


| Category | Female % | Male % |
|---|---|---|
| SLT | 7% | 93% |
| Head Office Management | 54% | 46% |
| Head Office Non-Management | 59% | 41% |
| Retail Estate Management | 22% | 78% |
| Retail Non-Management | 33% | 67% |
| Total | 38% | 62% |
Gender Pay Gap
The table below displays the gender pay gap, both mean and median and captures the difference between the hourly rate of male and female employees.
| Hourly Rate | Mean | Median |
|---|---|---|
| Female To Male | 43% Lower | 59% Lower |
Gender Bonus Gap
The proportion of male and female colleagues who received sales commission payments (a paid bonus) reflects the higher number of male employees in fulltime roles, where achievement of sales commission is more prevalent.


The percentage results below demonstrate the difference between the average bonus pay paid to male and female employees across the business.
| Hourly Rate | Mean | Median |
|---|---|---|
| Female To Male | 42.7% Lower | 25.7% Lower |
Our Aim, Our Commitment For The Future
We believe that we pay our employees for the role they are holding, also we internally promote employees based on their skills and qualities. We will continue to offer internal opportunities to every employee, regardless of their gender through internal promotions in our Stores and Head Office, along with personal development plans. We also provide workshops on equality diversity and inclusion to all senior management and other employees in order to encourage inclusion and avoid gender bias in every area of the business.
We also welcome female employees who have dependents and who require reasonable flexible working hours, however we believe that flexibility must be applied regardless of the gender and therefore male employees’ applications are embraced too, along with time off requests.
Our employees are integral to achieving our business objectives and we aim to attract, retain, and develop the best talent at every level throughout Moss Bros. We are committed to creating an environment where all individuals feel welcomed, respected and supported and our commitment to reducing the gender pay gap is an integral part of our inclusion strategy.
Data
Gender pay data is produced annually. This data is accurate as of 5th of April 2020. To see how the calculations have been produced please visit https://www.gov.uk/government/publications/gender-pay-gap-reporting-guidance-for-employers
This information can also be found on the government portal at https://gender-pay-gap.service.gov.uk/Viewing/search-results
The Gender Pay Gap Report for 2019 is available at /gender-pay-gap-2019
The Gender Pay Gap Report for 2018 is available at /gender-pay-gap-2018
The Gender Pay Gap Report for 2017 is available at /gender-pay-gap-2017